Whether you've got stories to tell or art to create, there's a place for you here.

Marketing Professionals
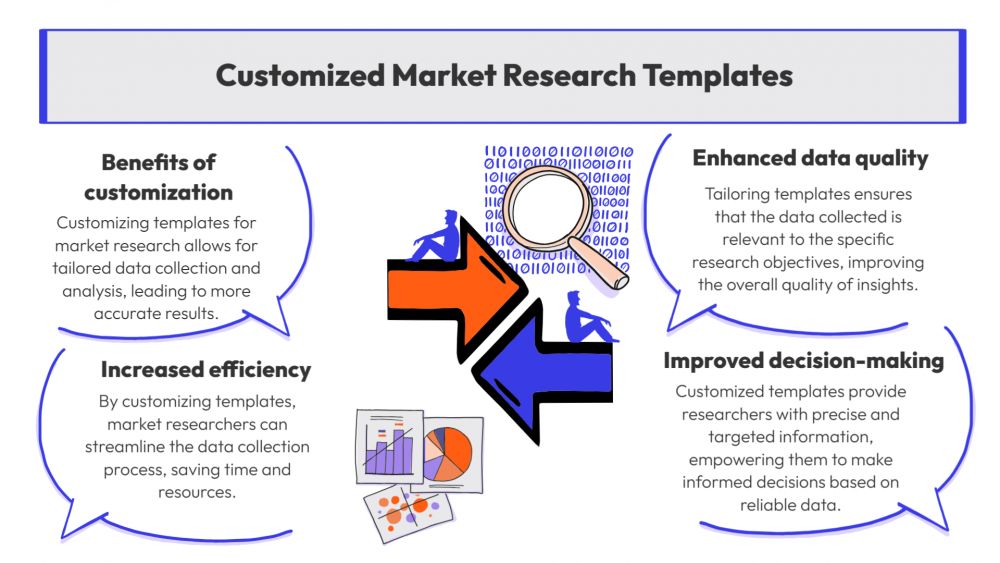
Customizing Templates for Market Research
-
ARAnshu Raj- Founder & CEO, Drawify
-
Nov 09, 2025 5 min read
Market research is indispensable for developing corporate strategy in today's data-driven age. Research findings can be difficult to communicate, however, particularly if the unstructured information seems overly complicated or text-heavy. Drawify can help with that. Drawify's customizable templates, hand-drawn graphics, and storytelling skills transform your market research studies into presentations that are understandable, captivating, and visually appealing.
Why Visualize Data from Market Research:
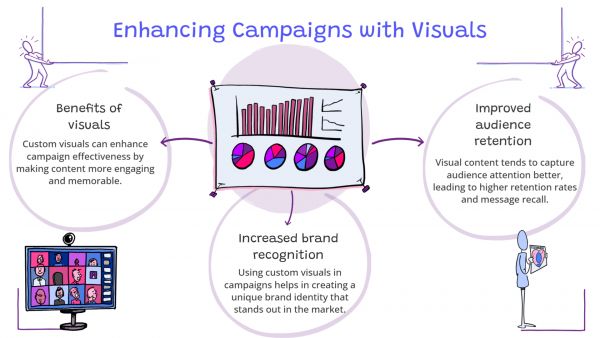
The vast amounts of data, trends, and consumer insights included in research studies may rapidly overpower your audience. This complexity is simplified through the use of visual storytelling. Infographics, charts, and illustrated storyboards are examples of visuals that can help you make your points more memorable and easier to understand.
Drawify helps analysts, researchers, and marketers bridge the gap between data and decision-making by enabling them to transform numbers into stories.

The Benefit of Drawify for Market Researchers:
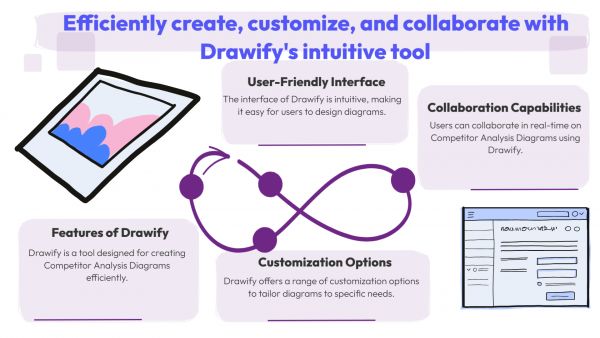
Contrary to conventional design tools, Drawify provides a special combination of pre-made, hand-drawn templates that may be customized for a range of research objectives, including survey results visualization, customer journey mapping, and competition analysis.
Here are some tips for integrating Drawify into your market research workflow:
1. Start with a Research Template:
Drawify offers a large selection of customization options designed for business analysis and presentations. You can choose a layout that works for your data and message, whether you're visualizing demographics, market segmentation, or behavioural insights.
2. Personalize Using Brand Components:
The adaptability of Drawify is one of its most significant benefits. Colours, typefaces, icons, and images may all be readily customized to reflect your brand identity. This assures that your visual reports stay on-brand, consistent, and professional.
3. For a Human Touch, Use Hand-Drawn Illustrations:
Data can come across as indifferent and icy. You can humanize your thoughts by incorporating Drawify's collection of hand-drawn illustrations. Stories that connect with stakeholders and clients can be created from dry statistics with a few creative sketches.
4. Integrate AI-Powered Upgrades:
Drawify assists you in selecting appropriate icons, layouts, and elements according to your subject matter with AI-assisted design recommendations. This keeps your design process clear and creative while accelerating it.
5. Easily Export and Share:
Your visuals may be exported in a variety of formats after they are complete, making them ideal for social media updates, presentation decks, and reports. No matter where your illustrations are shared, Drawify makes sure they keep their impact and quality.
Examples of Customizable Market Research Templates:
- Competitive Landscape Maps – Compare brands visually.
- Customer Personas – Create illustrated profiles of target audiences.
- Survey Results Dashboards – Turn data tables into visual charts.
- Trend Analysis Infographics – Showcase shifts in market behavior.
- SWOT Analysis Templates – Highlight strengths and opportunities visually.
Drawify's drag-and-drop interface allows users to customize each of these templates, enabling even non-designers to create expert-quality visuals.
Visual communication plays an important role for researchers and strategists as attention spans get shorter. Drawify makes insights useful in addition to making reports look fascinating. Presenting information graphically promotes quicker comprehension and wiser choices.
Drawify helps you produce research images that educate, motivate, and impact people, whether you work in marketing, consulting, or academia!
Post This Article to Your Socials
Popular Topics
- Events
- Workshops
- Visual Storytelling
- How to video
- Communities
- Sketchnoting
- Templates
- UX Designers
- Agile Professionals
- Product Managers
- Freelance Graphic Designers
- Creative Tech Enthusiasts
- Online Course Creators
- Social Media Content Creator
- Creative Agency Owners
- Marketing Professionals
- EdTech Professionals
- Scrum Masters
Similar Articles
Come, Be Part of Something Special
-
Got ideas that need visual superpowers?
Jump in and start creating presentations and communications that people actually remember.
Sign In -
Are you an artist ready to grow?
Join our Drawifier family and focus on what you love most - creating art that matters.
Become a Drawifier
Get visualisation tips every week
Subscribe to the Drawify Newsletter, and feed your creativity with visualisation tips and techniques, as well as the latest Drawify workshops, news and resources.
